Visualize Trace analytic #35
Comments
|
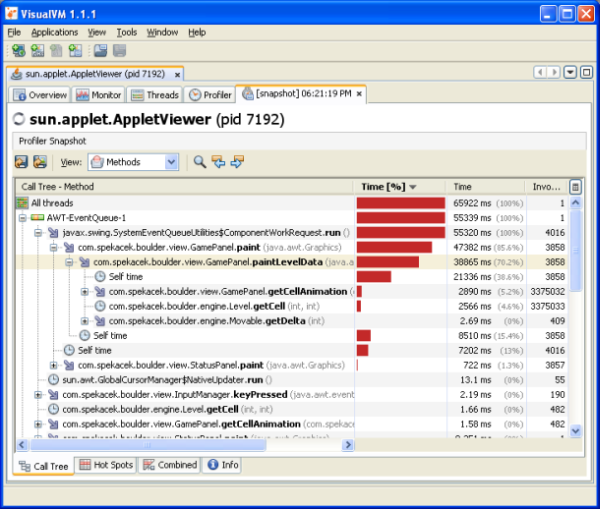
Example for a similar visualization from the Java domain, including time and percent of each function, as well as interactive tree widget |
|
I tried to connect to OSv through VisualVM remotely to help myself a bit during the development but was unable to. Any chance you have some tips about it? |
|
@dzautner https://github.com/cloudius-systems/osv/wiki/Debugging-OSv#profiling-java-applications If that doesn't help, ping @tgrabiec on the mailing list 😉 |
|
Thanks! forgot to add com.sun.management.jmxremote.authenticate=false, it's working now (: |
|
I think we should close this issue or at least remove the high priority tag considering the latest discussion about the feature? |
|
@dzautner we still want this feature, we simply do not know how to do it yet |
|
@tzach my mistake then, sorry |
Trace.py use the trace API to generate useful profiling information.
https://github.com/cloudius-systems/osv/wiki/Trace-analysis-using-trace.py
A visualization of the same information should be provided.
The following example data, should be presented as a horizontal bar chart, where each level can be dynamically extend/collapse.
The text was updated successfully, but these errors were encountered: